
Researchers use statistical tests to determine the likelihood that the effect or relationship they have found has occurred due to chance or not.
Many psychologists use the conventional rule that a probability of 5% or 0.05 is the cut-off point when deciding to either accept or reject an alternate hypothesis. When we carry out a statistical test on data, we always analyse the data at the 5%. This is typically displayed as:
p ≤ 0.05
This means that that there is a 5% probability that the results are due to chance/or something other than the IV. Therefore, there is 95% probability that the results are due to the experimental conditions i.e. your IV having an effect on your DV.
Researchers can test for significance at higher levels. For example, p≤ 0.01 (1% probability that results occur to chance, and 99% probability that the difference in the DV, was caused by the IV. However, researchers will always test at the 5% level first. If it is found to be significant at the 5% level, researchers will then test at higher levels.
Type I & Type II Errors
Because researchers can never be 100% certain they have found a statistically significant result, it is possible (usually up to 5% possible) that the wrong hypothesis may be accepted. There are two ways this can happen:
• Type I error – False positive – accepting the alternate hypothesis and believing that you have found significance when you actually have not.
• Type II error – False negative – accepting the null hypothesis and believing that you did not find significance when you actually did.
Alternatively, you can learn my silly rhyme:
Type I, you think you’ve won
i.e. you think you have found significance, but you haven’t.
Type II, you think it’s poo
i.e. you think you have not found significance, but you have.
Type I and Type II Errors in real life:
| Null Hypothesis | Type I Error / False Positive | Type II Error / False Negative |
| Person is not guilty of the crime | Person is judged as guilty when the person actually did not commit the crime (convicting an innocent person) | Person is judged not guilty when they actually did commit the crime (letting a guilty person go free) |
| Wolf is not present | Shepherd thinks wolf is present (shepherd cries wolf) when no wolf is actually present | Shepherd thinks wolf is NOT present (shepherd does nothing) when a wolf is actually present |
How do Type I and Type II errors occur?
When testing at the 0.05 level, researchers are leaving a 5% margin of error. Therefore, if the significance level is too lenient (too high) e.g. to 0.1, this increases the margin of chance to 10% and therefore it is more likely for type I or II errors to occur.
It’s hard to know when these errors have occurred, and this is why REPLICATION OF RESEARCH IS SO IMPORTANT!
Levels of Data:
Nominal Data –
- Data that are produced as named categories. For example you may ask someone what their favourite flavour milkshake is, the nominal categories: chocolate, strawberry and banana.
- Nominal data is known as discrete data. This means that each participants can only appear in one of the categories.
Ordinal Data –
- Data which can ranked in ‘order’ – ordinal.
- The data can be ranked in order i.e. from lowest to highest
- The gap between each piece of data is NOT equal.
- Data is non-continuous – there is an end point.
- Some examples of ordinal data would be a rating scale, likert scale, any form of test e.g. memory test, IQ test etc.
How to rank Ordinal Data –
To explain how to rank data, I will work through an example below:
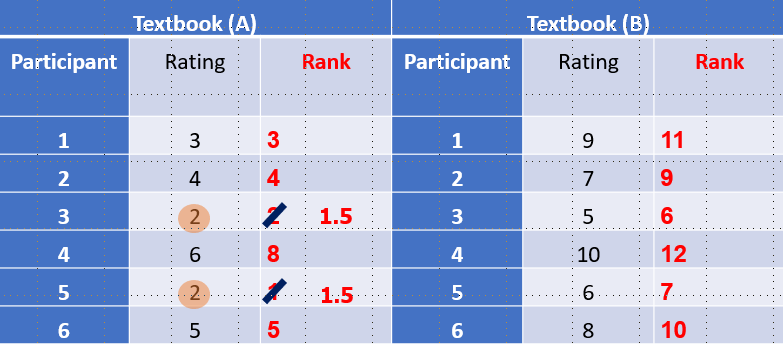
The teacher decided to conduct research with students to decide which resource to use for Psychology. One group were asked to use a text book, whereas the other group were asked to use the Psychology blog. At the end of the term the teacher asked her students to rate the resource on a scale of 1-10 (10 = high).
| Textbook (1) | Psychology blog (2) | ||
| Participant | Rating | Participant | Rating |
| 1 | 3 3 | 7 | 9 11 |
| 2 | 4 4 | 8 | 7 9 |
| 3 | 2 2 | 9 | 5 6 |
| 4 | 6 7 | 10 | 10 12 |
| 5 | 2 1 | 11 | 6 8 |
| 6 | 5 5 | 12 | 8 10 |
First of all, you will need to rank the data above, across both conditions, from lowest to highest. The original data is in black, the ranking is in bold red.
When looking at the rank scores, we can see that there are some scores are duplicated e.g. 2, 5, and 6. In such cases, you need to find the mean average of the ranks e.g. rating score “2” has been ranked as 1 and 2. Therefore, you add the ranks 1 + 2 = 3, then divide this by 2 = 1.5
Therefore, “2” is given a rank of 1.5. You apply this same calculation to any other numbers that are the same value. See below:
IMPORTANT NOTE: You wont ever be asked to rank a set of data, but you do need to explain how data is ranked. You may also be asked how to convert one level of data into another, and you would need to know how to rank data to convert interval data to ordinal data for example. We will go through this after interval data.
Interval Data –
- There needs to be an increase in value of points along your data (therefore the numbers of your data do have meaning)
- Divisions between the points on an interval scale are equal. For example, time, volume, speed, height, weight etc.
- The data is continuous – infinite
- Some examples of interval data would be time, weight, height, speed, money etc.
Below are 3 memory tools to help you choose the right statistical test and will also help you to find out whether your results are significant or not. You will need to refer back to these for every statistical test.
Converting one level of data into another
In your exams, you may also be asked to convert one level of data, into another level of data .
1.How would you convert ordinal data, and convert it to nominal data?
For example if you had an ordinal rating scale on self-esteem ratings, you could convert these into nominal categories by creating categories for a collection of the rating scale scores e.g. 1-3 = Low self-esteem, 4-6 = Mid self-esteem, and 7-10 = High self-esteem. You now have 3 categories to place the ordinal data into, to make it nominal.
2.How would you convert interval data, into ordinal data?
For example, if you had the interval data of weight for everyone in a study, you could convert this into ordinal data by ranking the lowest weight to the highest weight, and finding the mean average of the ranks that cover any duplicated data. See how to rank ordinal data above.
3.What levels of data, would you not be able to convert to and from? Explain why?
You would not be able to convert nominal data into ordinal or interval as the data is discrete. Ordinal data cannot be converted into interval as the gaps between the data are unequal. Some tests such as IQ have an end point, but are argued to be interval due to their standardisation, however, there are some types of ordinal data, that can never be standardised such as rating scales.
How to choose the appropriate statistical test:

How to find out if my statistical result is significant:
When using Sign test, Wilcoxon or Mann,
The calculated value is the same or less than
When using the other tests, that you love
The calculated value is the same or above
How to find the critical value:
Finding the critical value is so much fun
For a related test, calculate N – 1
An unrelated test, add the groups – 2
Chi-square needs a sum, to find the value
When finding Pearson’s r, it’s N – 2
All the other tests need N to find the value
Chi-square

The Chi-square test is a test which looks for patterns in nominal data (similarities). It tests whether the distribution of results in an experiment differs from what would be expected on the basis of chance alone. It does this by comparing the data actually collected with a data set based on the null hypothesis. The test can only be used for an independent measures design.
Checklist for using the chi-square test:
- DV produces nominal type of data
- Independent Measures design
- Exploring a difference between each condition (levels of the IV), or an association.
To work out the observed value for Chi-square you need to calculate the equation below. You won’t be asked to calculate the equation, but you may be asked to put numbers into the equation. Therefore you need to know what the symbols mean.
O: observed value = all raw data added together
E: expected value = all calculated data added together
∑: the sum of
In your exam you will be given the calculated value. However, you will need to know how to find the critical value and, you have to compare the calculated with the critical to determine whether the results were significant.
Steps for Chi-square:
- You need to find the critical value, and in order to do this, you must know how to calculate degrees of freedom (df) using this equation: (df) = (Number of Rows – 1) x (Number of Columns -1).
- Once you have calculated the df, you must go to the critical value table and go down the df column to the number that you calculated, and then go across the row to 0.05. This will lead you to your critical value.
- You then have to compare the critical value and the calculated vale. If the calculated value is more than the critical, it would be significant. If the calculated value is lower than the critical it would not be significant.
- If you do find a significant result, you would accept the alternate hypothesis and reject the null. If you did not find significance, you would accept the null and reject the alternate.
See the work example below:
This is a study that is investigating the difference between males ad females and the usage of earphones. The calculated value is 5.32.
| Male | Female | |
| Earphones in Ears | 16 (2.2) | 15 (3.5) |
| No earphones in ears | 6 (1.2) | 6 (1.2) |
| Earphones dangling around neck | 4 (0.3) | 3 (0.21) |
- The first step is to find the critical value, and you do this by calculating df with the following equation: (df) = (Number of Rows – 1) x (Number of Columns -1)
- In this case the number of rows = 3, and the number of columns = 2.
- 3-1 = 2
- 2-1 = 1
- 2 x 1 = 2
- df = 2
- You then need to go to the critical values table below, and go down to 2 df and across to 0.05, which gives the critical value 5.99.
- Because the calculated value of 5.32 is lower than the critical value 5.99, it is not significant. Therefore, the null hypothesis is accepted, and the alternate is rejected.
Critical values table:

Sign Test
Checklist for using the Sign test:
- DV produces nominal type data
- Repeated Measures design
- Exploring a difference between each condition (levels of the IV).
Step one:
Data is categorised into a table of results.
Step two:
Positive and negative signs need to be added. In this case if condition A is yes and condition B is no a plus is added and the opposite would be a minus. It doesn’t matter which way you direct the pattern, as long as it is used consistently for the whole data set. Any participants that present the same data for each condition are labelled as 0 – as you will need to ignore them
| Participant | Share French fries with celebrity(Condition A) | Share French fries with students from another school(Condition B) | Flow of direction |
| 1 | yes | no | + |
| 2 | no | yes | – |
| 3 | yes | yes | 0 |
| 4 | yes | no | + |
| 5 | yes | no | + |
| 6 | no | no | 0 |
| 7 | yes | no | + |
| 8 | no | yes | – |
| 9 | no | yes | – |
| 10 | yes | no | + |
Step three:
This step requires the counting of each positive and negative sign assigned to each participant’s scores.
YES-NO (+) TOTAL = 5
NO-YES (-) TOTAL = 3
Step four:–
The smallest of the total + or – scores is the CALCULATED VALUE.
CALCULATED VALUE = 3
It’s that simple! So simple that you are probably thinking why and earth is Chi-square so difficult in comparison. It is also important to note, that if the + and – signs are the same, then that number would be you calculated value.
Step five:
Level of significance – this requires looking the sign test critical values table.
| N | 0.05 | 0.01 |
| 5 | 0 | |
| 6 | 0 | 0 |
| 7 | 0 | 0 |
| 8 | 1 | 0 |
| 9 | 1 | 1 |
| 10 | 1 | 1 |
| 11 | 2 | 1 |
| 12 | 2 | 2 |
| 13 | 3 | 2 |
| 14 | 3 | 2 |
| 15 | 3 | 3 |
The level of significance is 0.05 for a 1 tailed test.
N = number of participants whose scores were use. This means ignoring the participants that were assigned a zero because they had the same scores, for example, “no no”
In this example, Number of participants scores used = 8 participants.
Therefore, the CRITICAL VALUE = 1
Does this mean the study was significant?
In this example,
The CALCULATED VALUE = 3
The CRITICAL VALUE = 1
Use this rhyme to work out whether it is significant.
When using Sign test, Wilcoxon or Mann,
The calculated value is the same or less than
When using the other tests, that you love
The calculated value is the same or above
In order for this study to be significant, the calculated value must by the same or LESS than the critical value.
In this worked example, the CALCULATED value is less than the CRITICAL VALUE. Therefore, this suggests the study is NOT SIGNIFICANT and the level of sharing amongst the Psychology students peers does not affect their willingness to share French fries with either a celebrity or other students from a different school. As a result, the null hypothesis is accepted and the alternate hypothesis is rejected.
Spearman’s Rho

The aim of Spearman’s Rho is used to examine the relationship between two co-variables. Spearman’s Rho uses ranks rather than actual values.
This test is used when the hypothesis predicts a correlation between two variables. It produces an observed value given the name ‘r’. To use Spearman Rho there has to be ordinal or interval data and a correlation design. Spearman’s Rho test initially rank orders each variable separately. If the rank orders are high (or low) for each condition then a positive correlation is expected. But if they are ranked high in one condition and not the other then the correlation is negative.
Checklist for using the Spearman’s Rho test:
- Appropriate for variables that produces at least ordinal type of data
- Exploring a relationship between co-variables
- A correlational design has been used.
As part of calculating the observed value, you must rank the data. However, this time you must rank the data for each co-variable separately.
Step one:
| Participant | Years with a social media account | Rating of whether social media profile is an effective tool for connecting with friends |
| 1 | 1 | 1 |
| 2 | 3 | 3 |
| 3 | 2 | 3 |
| 4 | 4 | 2 |
| 5 | 5 | 5 |
| 6 | 2 | 2 |
| 7 | 1 | 1 |
| 8 | 4 | 3 |
| 9 | 3 | 4 |
| 10 | 6 | 5 |
| 11 | 3 | 2 |
| 12 | 1 | 1 |
| 13 | 2 | 2 |
| 14 | 4 | 3 |
| 15 | 3 | 5 |
Step two:
When there are numbers of data which are the same value.
For this data the sum of d2 = 129
Calculated value= +0.77
What does this value suggest?
Reminder: If the calculated value is:
a minus number = Negative Correlation
0 = no correlation
a positive number = Positive correlation
In this worked example, the calculated value = +0.77 this indicates a strong positive relationship between the number of years of social media membership with higher ratings in seeing the effectiveness in connecting with friends. However, we now need to know whether this is significant.
Spearman’s Rho Table of critical values is below.
The number of participants in this piece of research was 15; therefore the n value is 15. We are also looking at the standard 0.05 significance level.
| Number of pairs | p = .05 | p = .01 | p = .001 |
| 5 | 1.000 | —— | —— |
| 6 | 0.886 | 1.000 | —— |
| 7 | 0.786 | 0.929 | 1.000 |
| 8 | 0.738 | 0.881 | 0.976 |
| 9 | 0.700 | 0.833 | 0.933 |
| 10 | 0.648 | 0.794 | 0.903 |
| 11 | 0.618 | 0.755 | 0.873 |
| 12 | 0.587 | 0.727 | 0.846 |
| 13 | 0.560 | 0.703 | 0.824 |
| 14 | 0.538 | 0.679 | 0.802 |
| 15 | 0.521 | 0.654 | 0.779 |
| 16 | 0.503 | 0.635 | 0.762 |
| 17 | 0.488 | 0.618 | 0.743 |
| 18 | 0.472 | 0.600 | 0.725 |
| 19 | 0.460 | 0.584 | 0.709 |
| 20 | 0.447 | 0.570 | 0.693 |
Use this rhyme to work out whether it is significant.
When using Sign test, Wilcoxon or Mann,
The calculated value is the same or less than
When using the other tests, that you love
The calculated value is the same or above
Therefore 0.521 is the CRITICAL value, which is less than the CALCULATED value of 0.7697 and results are significance. This supports the fact there is a significant strong positive correlation/relationship. This means the alternate hypothesis would be accepted and the null hypothesis would be rejected.
Correlation Coefficient: a number between -1 and 1 that tells us how strong the relationship is
+1.0 perfect positive correlation
+0.8 strong positive correlation
+0.5 moderate positive correlation
+0.3 weak positive correlation
0 no correlation
-0.3 weak negative correlation
-0.5 moderate negative correlation
-0.8 strong negative correlation
-1.0 perfect negative correlation
Pearson’s
Pearson’s is very similar in the sense that you need to be able to recognise the strength and direction of the relationship from the calculated value. But to find the critical value you need to find the total number of participants – 2.
| Participant | Weight in KG | Money per month in pounds |
| 1 | 89 | £1202 |
| 2 | 76 | £2010 |
| 3 | 100 | £950 |
| 4 | 92 | £1030 |
| 5 | 68 | £1400 |
| 6 | 50 | £550 |
| 7 | 63 | £2200 |
| 8 | 72 | £3000 |
| 9 | 93 | £950 |
| 10 | 107 | £1100 |
Non directional hypothesis: There will be a relationship between weight in KG and money earned per month. The calculated value was .77. Is there a significant relationship using a non-directional/two-tailed hypothesis?
N – 2 = 8
Critical value = 0.632
Calculated value = .77
The strong positive relationship IS significant because the calculated value was greater than the critical. Accept alternate and reject null.
Pearson’s Critical Values table:

Mann Whitney

The Mann Whitney test looks for a difference in the DV between two conditions of an IV, collects ordinal data and uses an unrelated (independent measures) design.
You do not need to calculate Mann Whitney, the examiners will provide you with the calculated value in the exam, however, they may ask you to find the critical value.
To find the critical value, use the critical value table by going across the n1 column (number of participants in condition 1) and then down the n2 column (number of participants in condition 2), and use the 0.05 level.
Compare the critical value and the calculated value. If the calculated value is the same or LESS than the critical, it would be significant. If the calculated value is less than the critical, it would not be significant.

Wilcoxon
There is no equation for the Wilcoxon test. The Wilcoxon tests for a difference between two conditions of an IV, collects ordinal or interval data and uses a repeated measures design.
You do not need to calculate Wilcoxon, the examiners will provide you with the calculated value in the exam, however, they may ask you to find the critical value.
To find the critical value, go to the critical value table and go down the N column by the number of ppts = 9, and then go across 0.05.
If the calculated value is the same or less than the critical, it is significant.

Related & Unrelated t-test
To find the critical value for a related t-test it is N-1 (number of participants -1) then you go across to 0.05.
To find the critical value for an unrelated t-test it is N-2 (number of participants -2) then you go across to 0.05.
However, remember, that when using a Matched Pairs design for any study this is classed as RELATED/REPEATED. This is because they are assumed to be the same participant due to being matched on a certain characteristic.

