
Self-Report: Asking a participant about their thoughts and behaviour and recording their answers. There are 2 main types of self-report:
- Questionnaires
- Interviews
Self-reports can be used as part of an experiment, as a way of measuring the dependent variable (DV).
For example I am interested in finding out if the amount of chocolate that is consumed affects our mood. The amount of chocolate would be manipulated (IV) and I would measure the mood of the participant by using self-report (asking them to rate on a scale of 1-10, 10 = being happy).
However, a self-report can be used with no experimental manipulation (i.e. no IV). For example, interviewing someone about their life.
Key terms:
- Qualitative data: Non-numerical data, rich in detail, usually textual or verbal and provides descriptions.
- Quantitative data: Numerical data, measurements of quantity or amount or how often something has occurred.
Questionnaires
A series of questions in a written form.
Strengths of questionnaires:
- Easy to administer and can be emailed to participants, making them time and cost efficient.
- Participants maybe more truthful than in an interview if answers are personal as they are writing them down without immediate judgement of someone.
- Data easy to analyse if quantitative because patterns and trends can be easily identified due to everyone being asked the same questions (good reliability).
- Can collect both quantitative and qualitative data through the use of closed questions and open questions.
Weaknesses of questionnaires:
- Response biases – e.g. tending always to say no, or always ticking the same box for every question. This is more likely if only closed questions are used.
- If open questions are used, people may provide little detail or may leave them blank because they can’t be bothered.
- Limited because there is less flexibility. If someone has written an answer that you do not understand, it can lead to the research being misinterpreted
Interview:
A series of questions are given verbally, face-to-face between an interviewer and an interviewee.
Different types of interview:
Structured:
Predetermined questions, no other questions are asked apart from the ones planned.
Unstructured:
A topic of discussion is planned, but no questions are decided in advance, they tend to be open questions, but can be a mixture of open and closed.
Strengths of interviews:
- Structured interviews are easier to analyse if quantitative.
- Semi-structured and unstructured interviews enable the researcher to gain detailed info by being able to ask further questions if they need to seek clarity.
- In face-to-face interviews, the interviewer can respond more flexibly to gain useful, detailed info.
- Can collect both quantitative and qualitative data through the use of closed questions and open questions.
- Structured interviews can be easily repeated to increase external and internal reliability.
Weaknesses:
- Structured interviews are limited by fixed questions. This may lead to the interviewer with data that they don’t understand as they are unable to ask further questions to seek clarity. This could then reduce validity.
- Researcher bias can occur. The expectations of the interviewer may alter the way the respondent answers questions.
- Participants can be affected by biases such as social desirability and leading questions.
- Only some people are willing to participate in interviews so may not be representative of the population.
Types of questions:
Open questions tend to provide qualitative data, as you allow the participant to respond however they want and this can be rich in detail.
e.g. How would you describe your first experience of riding a bike?
Yet, sometimes, questions can still be left open, but gather quantitative data.
e.g. How old were you when you first learnt to ride a bike?
This question leaves the answer open to the participant to respond however they want, but provides a numerical value.
Strengths of open questions:
- They produce qualitative data, giving participants an opportunity to fully express their opinions, thus increasing validity.
- All info is analysed so information is not lost by averaging answers – increasing validity.
Weaknesses of open questions:
- Qualitative data is time consuming to analyse as themes need to be identified.
- Interpretation of qualitative data from open questions can be subjective, leading to bias. This can lead to issues of validity. In addition, the inconsistency of interpreting data can lead to low inter-rater reliability.
- Open questions may not always collect insightful and detailed data as participants can be reluctant to provide long answers.
Closed questions only provide quantitative data, as you limit the number of responses the participant gives, so their response is lacking in detail. Yet, you also can count how often someone gives a response providing quantitative data.
e.g. Do you have a pet Yes/No
You need to know the following types of closed questions:Likert scaleRating scale
Likert scale questions are whereby participants indicate on a scale how much you agree with a statement. It is also known as a verbal rating scale.
“Psychology is the most important subject ever”. Circle one answer.
- Strongly agree
- Agree
- Unsure
- Disagree
- Strongly Disagree
Rating scale questions: This type of question asks the the individual a question, and then they must highlight on a numerical scale where they feel best reflects their view
On a scale of 1-10 How much do you love Chocolate? (1 being low, 10 being high)
1 2 3 4 5 6 7 8 9 10
Strengths of closed questions:
- Closed questions are quick and easy for participants to answer.
- Closed questions are more likely to be structured in a certain order, there fore high in internal reliability.
- Due to time efficiency, large samples can be collected increasing generalisability.
- Quantitative data easy to analyse e.g. find median, modes and draw graphs.
Weaknesses of closed questions:
- Lacks detail, participants can’t express opinions fully, lacks validity.
- Risk of response bias e.g. saying yes to everything.
- The score for all participants on each question is only nominal data so only the mode can be calculated. Limited analysis.
Ways to Measure the Validity of a Questionnaire
Validity refers to whether a questionnaire actually measures what it is intended to measure.
Face Validity
- Ask people (or experts) to judge whether the questions appear to measure the intended topic.
- Example: A stress questionnaire should contain questions about stress, not intelligence
Concurrent Validity
- Compare scores from the new questionnaire with scores from an established, validated questionnaire measuring the same thing.
- If participants score similarly on both measures, the new questionnaire has high concurrent validity.
Ways to Improve Validity of a Questionnaire
- Use clear, unambiguous questions so participants interpret them as intended.
- Avoid leading questions that encourage a particular answer.
- Avoid double-barrelled questions (asking two things at once).
- Use a pilot study to identify confusing or misleading questions before the main study.
- Ensure questions are relevant to the construct being measured. For example, a stress questionnaire should only include questions about stress.
- Use anonymous responses when investigating sensitive topics to reduce social desirability bias and encourage honest answers.
- Include reverse-scored questions to check whether participants are paying attention and responding thoughtfully.
Ways to Measure Reliability of a Questionnaire
The reliability of a questionnaire can be measured using test-retest reliability, where researchers give the questionnaire to the same participants on two occasions and calculate the correlation between the two sets of scores. A high positive correlation indicates that the questionnaire is reliable because it produces consistent results over time.
Reliability can also be assessed through internal consistency, such as split-half reliability or Cronbach’s alpha, which measure whether all items in the questionnaire are consistently measuring the same construct. This is only relevant for questionnaires or tests that assess the same construct throughout e.g. maths test, IQ test etc.
Ways to Improve the Reliability of a Questionnaire
- Use clear aquestions so that all participants interpret them in the same way. Provide clear response options that do not overlap.
- Avoid complex language, jargon, and double-barrelled questions (questions asking two things at once).
- Use standardised instructions so every participant completes the questionnaire under the same conditions.
- Conduct a pilot study to identify and remove confusing or misleading questions.
- Use closed questions (e.g., rating scales, Likert scales) where possible, as responses are easier to score consistently.
Correlations
Correlations are a measure of how strongly two or more co-variables are related to each other:
Height is positively correlated to shoe size
The taller someone is, the larger their shoe size tends to be.
Like Self Report and Observation, there is no manipulation of data, conditions or groups in correlations.
No IV or DV, just to co-occurring variables (co-variables).
Unlike experiments there is no IV, just two variables that occur together as ‘co-variables.’
As there is no IV to manipulate we cannot establish cause and effect.
We don’t know which variable is causing the other, we just know there is a relationship between them.
Correlations can be both the primary method or secondary technique.
Self reports and observations can both be used as a way to gather data on variables, and then see if there is a relationship between them.
Primary method:
Correlations
Secondary technique:
Self report/Observation
For example, I want to see if there is a relationship between friends on social media and happiness levels. I could use questions to collect the data for each co-variable of social media friends and happiness, therefore my secondary method is self-report.
Types of Correlation:
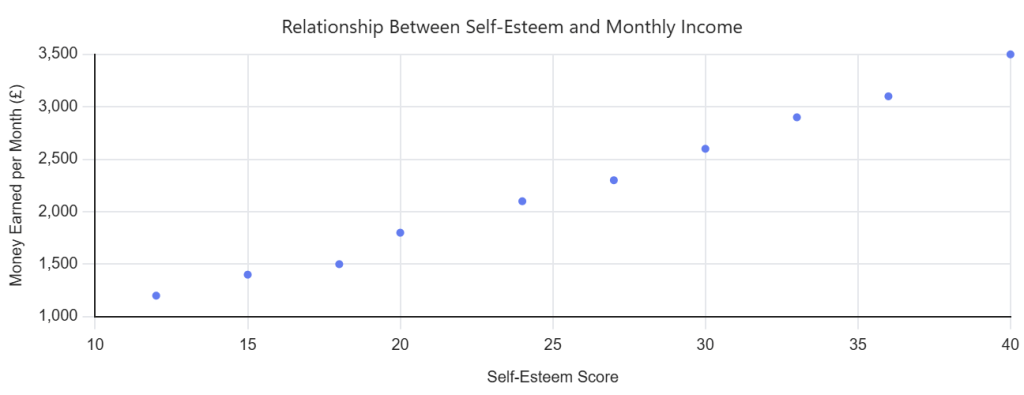
- Positive Correlation: as one variable increases, so does the other OR as one variable decreases so does the other.
- Negative Correlation: as one variable increases, the other decreases.
- No Correlation: there is no relationship between the variables.
Correlation Coefficient: a number between -1 and 1 that tells us how strong the relationship is. We will be learning about statistical tests that calculate the correlation coefficient later on in the course.
How is Correlation Coefficient interpreted?:
+1.0 perfect positive correlation
+0.8 strong positive correlation
+0.5 moderate positive correlation
+0.3 weak positive correlation
0 no correlation
-0.3 weak negative correlation
-0.5 moderate negative correlation
-0.8 strong negative correlation
-1.0 perfect negative correlation
How are correlations presented?
Scatter graphs:
We can display correlation data in scatter diagrams.
One variable (amount of revision done) along one axis and another variable (final grade) along the other.
Each ‘point’ on the scatter diagram represents one participant: how much revision they put in and what their final grade was.
Hypotheses for correlations:
Null Hypothesis
Alternate hypothesis (directional and non-directional)
Correlations can’t show cause and effect
Instead of the word effect (which is only used for experiments) in a correlation we use the word relationship when writing a hypothesis.
Null hypothesis: There will be no relationship between co-variable 1 and co-variable 2.
Alternate hypothesis:
Directional: There will be a significant positive/negative relationship between co-variable 1 and co-variable-2
Non-directional: there will be a significant relationship between co-variable 1 and co-variable 2.
When writing a hypothesis in your exams, you must make sure that you fully operationalise each co-variable i.e. explain how you will measure each co-variable.
For example:
A fully operationalised one-tailed hypothesis: There will be a positive relationship between how many Facebook friends someone claims to have via an open question and how happy they rate them selves on a scale of 1-10, 1 being very unhappy and 10 being very happy.
Strengths of correlations:
- Makes a good pilot study to generate a hypothesis for an experiment.
- Can research variables that would be unethical to manipulate.
- Can understand the relationship between two variables (positive/negative, weak/strong).
- Only collects quantitative data, so tends to be easy to collect and easy to analyse by plotting data on a scatter graph. From the graph, you can see straight away of there is a relationship.
Weaknesses of correlations:
- Correlations do not show causation. They CANNOT establish cause and effect!
- They have the same weakness as whatever method was used to gather the data for the co-variables (observation/self report).
- An observed correlation between two variables may be due to the common correlation between each of the variables and a third variable rather than any underlying relationship (in a causal sense) of the two variables with each other. In other words, when two variables, a and b, are found to be positively or negatively correlated, it does not necessarily mean that one relates to the other: It may be that changes in an unmeasured or unintended third variable, c, are causing a random and coincidental relationship between the two variables by independently changing a and b. For example, as the sales of air conditioners increase, the number of drownings also increases: The unintended third variable in this case would be the increase in heat.
- Correlations can be misleading i.e. Bacon is linked to cancer!!!! Burt sometimes people can misinterpret and assume that bacon can cause cancer, which is not a possible conclusion to draw from a correlational study.
NEVER USE DIFFERENCE, EFFECT OR CAUSE when describing a correlation –
CORRELATIONS look for RELATIONSHIPS – NOT EFFECTS
 CGS Psychology Blog: Mrs Harris